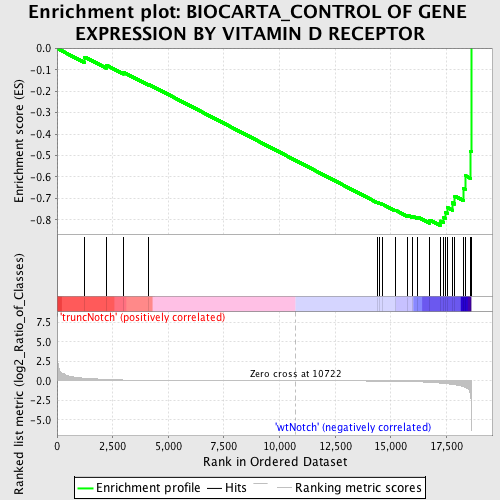
Profile of the Running ES Score & Positions of GeneSet Members on the Rank Ordered List
| Dataset | Set_03_truncNotch_versus_wtNotch.phenotype_truncNotch_versus_wtNotch.cls #truncNotch_versus_wtNotch |
| Phenotype | phenotype_truncNotch_versus_wtNotch.cls#truncNotch_versus_wtNotch |
| Upregulated in class | wtNotch |
| GeneSet | BIOCARTA_CONTROL OF GENE EXPRESSION BY VITAMIN D RECEPTOR |
| Enrichment Score (ES) | -0.8271594 |
| Normalized Enrichment Score (NES) | -1.6329093 |
| Nominal p-value | 0.010638298 |
| FDR q-value | 0.58712626 |
| FWER p-Value | 0.66 |
| PROBE | DESCRIPTION (from dataset) | GENE SYMBOL | GENE_TITLE | RANK IN GENE LIST | RANK METRIC SCORE | RUNNING ES | CORE ENRICHMENT | |
|---|---|---|---|---|---|---|---|---|
| 1 | SMARCD1 | 3060193 3850184 6400369 | 1240 | 0.347 | -0.0402 | No | ||
| 2 | PRMT1 | 2850050 | 2205 | 0.189 | -0.0777 | No | ||
| 3 | VDR | 130156 510438 | 2988 | 0.107 | -0.1115 | No | ||
| 4 | CHAF1A | 6040647 | 4123 | 0.054 | -0.1684 | No | ||
| 5 | NCOA2 | 940347 2850725 | 14393 | -0.022 | -0.7190 | No | ||
| 6 | RXRA | 3800471 | 14505 | -0.024 | -0.7231 | No | ||
| 7 | TSC2 | 1450494 | 14629 | -0.027 | -0.7277 | No | ||
| 8 | NCOA3 | 4540195 | 15205 | -0.045 | -0.7552 | No | ||
| 9 | SNW1 | 4010736 | 15740 | -0.076 | -0.7781 | No | ||
| 10 | CARM1 | 7040292 | 15993 | -0.096 | -0.7843 | No | ||
| 11 | TOP2B | 6980309 | 16219 | -0.116 | -0.7876 | No | ||
| 12 | SMARCE1 | 4920465 4390398 | 16743 | -0.186 | -0.8016 | No | ||
| 13 | HDAC1 | 2850670 | 17220 | -0.280 | -0.8058 | Yes | ||
| 14 | CREBBP | 5690035 7040050 | 17381 | -0.327 | -0.7895 | Yes | ||
| 15 | NCOA1 | 3610438 | 17461 | -0.346 | -0.7673 | Yes | ||
| 16 | SMARCA4 | 6980528 | 17558 | -0.371 | -0.7442 | Yes | ||
| 17 | NCOR1 | 3710132 | 17768 | -0.450 | -0.7211 | Yes | ||
| 18 | SUPT16H | 1240333 | 17875 | -0.491 | -0.6894 | Yes | ||
| 19 | COPS2 | 3060142 | 18265 | -0.735 | -0.6543 | Yes | ||
| 20 | SMARCC1 | 5080019 7100047 | 18369 | -0.848 | -0.5951 | Yes | ||
| 21 | ACTL6A | 5220543 6290541 2450093 4590332 5270722 | 18570 | -1.652 | -0.4799 | Yes | ||
| 22 | ARID1A | 2630022 1690551 4810110 | 18616 | -6.327 | -0.0000 | Yes |

